Warren Buffet made about 95% of his wealth since the age of.....60! The average person becomes a millionaire closer to the age of 60, and women hit this milestone sooner than men, under 59 years of age.
Re-financing volume are up over 160% from a year ago. (CNBC)
10,000 Americans turn 65 years old EVERY DAY...and this will continue to 2030. (Crain's)
Recession Obsession
Recession talk has become somewhat obsessive over the past few weeks and many have reached out to me for my opinion on this subject. Whilest I am not an expert, I thought I would share some facts about recessions since - and including - the Great Depression (a once-in-a century occurrence):
There have been 14 recessions total since and including the Great Depression of 1929, or one every 6.4 years. We have not had a recession in 10 years.
64% of recessions since 1929 lasted under 1 year.
Unemployment rose above 10% in only three recessions. In the past 50 years, unemployment averaged 8.25% during recession.
In the past 50 years the average GDP decline was just 2.2%. Currently the USA GDP is growing over 2% annually.
ATTOM Data Solutions looked at home prices during the five recessions since 1980 and found that only twice—in 1990 and 2008—did home prices come down during the recession, and in 1990 it was by less than a percent. During the other three, prices actually went up.
Buying a home during a recession
Many buyers think waiting till a recession hits will allow them to buy 'bargains'. This may be true for some all-cash buyers, although history has taught us that when a recession hits:
The best properties are often withdrawn from the market IF there are signs of price declines.
Interest rates may be lowered, but obtaining financing becomes tougher as banks usually tighten lending standards.
If you lose your job, its almost impossible to obtain a mortgage.
Cash buyers are always waiting for opportune moments to buy. Competing with these buyers is tough enough during good times. Its worse during tough times.
Rents tend to rise during recessions as fewer people qualify for a mortgage to be able to buy. Homeowners who have to foreclose also add new demand for rental housing.
Much of the housing demand is driven by employment. A spike in unemployment could negatively impact demand, particularly if an intensifying trade war leads to export tariffs, which could put jobs at risk. But with unemployment at 2.4% in San Francisco, it would take a pretty dramatic rise to cause home prices to drop.
In addition, tariffs on imports and tight immigration policy could push constructions costs even higher - all which could impact supply and ensure that housing prices will not slow down , if any at all.
Most importantly, we need to remind ourselves that even in the WORST recessions life goes on: people get married, divorced, die, give birth, etc and the vast majority continue working and earning.....and living.
San Francisco Happenings
Mid-Autumn Festival at Off the Grid: Fort Mason Center.
Friday Sept 13 | 5:00- 10:00 PM
De Young Museum: Free Saturdays for SF Residents Saturdays | 9:30 AM - 5:15 PM
Hayes Valley Urban Air Market Sunday Sept 15 | 11:00 AM - 6:00 PM
Updated June 1, 2019: This map reflects median home sales prices in San Francisco neighborhoods for the 12-month period through May 2019. Median sales prices are generalities that often fluctuate and can be affected by other factors besides changes in fair market value. They typically disguise a huge range of prices in the underlying individual sales, and how these median sales prices relate to any particular home is impossible to say without a specific comparative market analysis. All prices should be considered approximate. Data per sales reported to MLS, deemed reliable, but may contain errors and subject to revision.
Introducing Compass Concierge - a program that fronts the cost of home improvements services like staging, painting, deep-cleaning and cosmetic improvements with NO UPFRONT COSTS, NO INTEREST FEES, NO HIDDEN CHARGES - EVER!
Introducing Compass Concierge - a program that fronts the cost of home improvements services like staging, painting, deep-cleaning, and cosmetic improvements with NO UPFRONT COSTS, NO INTEREST FEES, NO HIDDEN CHARGES - EVER!
If you’re not convinced, look at these before and after photos of a home I sold. The sellers received 8 offers and the home sold for $700,000 OVER the asking price.
Here are some of the things Compass Concierge has been used for:
Architecture plans
Garage door repair
Pest inspection
Art rental
Gas pipe replacement
Photography
Asphalt repair
General contractor
Plumbing repair
Asphalt sealing
Grout repair
Pool recoating
Attic repair
Gutter repair
Power washing
Backyard renovation
Handyman repair
Presale inspections
Bathroom remodel
Hardscape
Pressure washing
Bathroom improvements
HVAC repair
Reglaze tub
Cabinet repairs, refinishing or resurfacing
Interior painting
Re-tiling bathrooms
Cabinet replacement
Kitchen counter tops
Roof brightening
Carpet cleaning
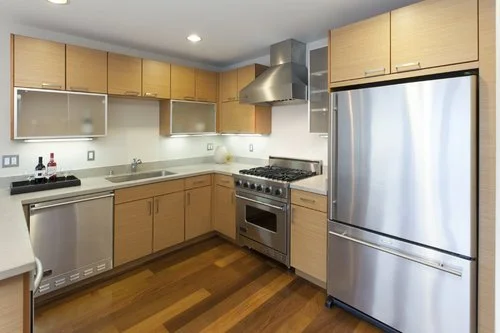
Kitchen improvements
Roofing repair
Carpet replacement
Landscaping
Scaffolding
Caulking
Light fixtures
Seller-side evaluations
Closet renovation
Lighting
Sewer lateral inspections & remediation
Color consultation
Marketing campaign
Sewer line maintenance
Concrete staining
Masonry work
Side fencing
Cosmetic renovations
Mold remediation
Slab jack
Custom closet work
Moving & storage
Smoke smell removal
Deck refinishing & repair
New appliances
Soundproofing
Decluttering
New cabinets
Staging
Deep-cleaning
New carpet
Stairs resurfacing
Design consultations
New decks
Termite extermination
Driveway repair
New dishwasher
Tile repair
Dry rot repair
New driveway
Trash removal
Drywall repair
New fencing
Tree inspection
Electric outlet repair
New front door
Tree removal
Electrical work
New furnace
Utility maintenance
Environmental analysis
New garage door
Virtual staging
Exterior cleaning
New hardwood floors
Wallpaper removal
Exterior painting
New HVAC
Water heating repairs
Fencing repairs
New sinks
Waterproofing
Floor refinishing, lamination & updates
New tub
Window cleaning
Floor plans
Painting
Window replacements
Furnace repair
Permitting
Wine unit installation
Furniture
Pest control & remediation
To find out how I can help you move to what’s next, without any upfront costs, give me a call.
The latest Case-Shiller Index for the SF Metro Area was released, and showed a significant jump back up in prices from the large drop that occurred in the second half of 2018 - and is now close to the peak prices seen in late spring/early summer 2018.
According to the latest report from the state Employment Development Department, California added 46,000 jobs in April – the largest monthly gain since March 2017.
While monthly job additions have varied a lot since the beginning of the year, California led all states in the monthly increase. The state has added 271,600 jobs over the last year, which is a 1.6 percent year-over-year increase – slightly behind the 1.8 percent overall national growth rate.
The state’s unemployment rate remained steady at 4.3 percent in April. Labor force declined, however, by 52,200 in April, after some solid increases in first three months of the year. Compared to a year ago, the labor force has increased by 203,900 people.
With 46,000 jobs added over the month, 9 out of 11 industries added jobs in January, with largest gains in educational and health services, up 17,300 jobs, followed by leisure and hospitality, up 12,100 jobs. Information and minting and logging posted monthly losses.
In annual comparison, 10 out of 11 industries added jobs with health services showing the largest gains, up 78,800 jobs, followed by professional and business services, up 66,900 jobs. Only financial activity posted an annual loss of 2,700.
Regionally, Los Angeles finally showed a rebound after a rocky start to 2019. Los Angeles County added 19,300 jobs over the month and 56,100 over the year. The region’s labor force, however, declined by 20,000 which is not encouraging for hiring trends going forward. Nevertheless, monthly gains were largely focused in leisure and hospitality, with a larger than usual seasonal addition. Construction also saw above-average April gains bringing the sector’s employment to the highest level in more than a decade. On the annual basis, the health and wellbeing of an aging population continues to influence large gains. Job additions in healthcare and social assistance, up 18,800, accounted for ninety-two percent of the overall sector job growth to reach a new all-time high. On the other hand, losses were focused in financial services, particularly, finance and insurance, though apparel manufacturing was down as well.
In the Bay Area, gains were broad based across the regions and most regions saw unemployment rate decline again falling below the year-ago bottom. In San Francisco-San Mateo region, up 5,000 jobs, monthly gains were led by healthcare job additions, followed by leisure and hospitality, and solid gains in information.
In the Santa Clara-San Benito region, up 6,400 jobs, gains were also led by leisure and hospitality, but also specialty trade contractors, and information. Computer and electronic product manufacturing posted 1,100 losses.
In Alameda and Contra Costa, up 6,800 jobs, similar trends followed with healthcare and social assistance leading the gains followed by leisure and hospitality.
High-Demand Spring Market Slightly Below Last Year's Home Price Peaks
May 2019 Report
With April’s end, we now have 2 months of spring season data unaffected by the end of 2018, when financial markets plunged. As of early May 2019, stock markets have recovered to hit new highs, interest rates are far lower than last year’s peak, and our local, unicorn IPOs have begun to roll out after a media frenzy of speculation on their potential effects on the market.
The market has heated up considerably from the slowdown in the second half of 2018, with strong buyer demand for a very limited inventory of listings. Median home sales prices have returned to highs close to those in spring 2018, but, so far, last year’s peaks have not been exceeded. This is a big change from the year-over-year appreciation rates of the past 6-7 years.
However, there are still 2 months of spring sales data to come in (before the typical summer slowdown), and word on the street is that some new listings are again generating feverish bidding wars between buyers.
Monthly Median House Sales Prices
Monthly median sales prices are often affected by other factors besides changes in fair market value – for example, the extreme seasonality of luxury home sales – but the above chart helps illustrate trends over the past 2 years: Spring 2018 was one of the hottest markets in history, with dramatic year-over-year price appreciation. The market then cooled, stock markets turned scary, and interest rates climbed. 2019 has heated up again, but, so far,
without any y-o-y median price gains.
The most expensive housing market in the country has, for the time being, stopped becoming more expensive.
Year-over-Year Comparisons
The table below compares the March-April market statistics of 2018 and 2019. Prices were stable, overbidding was down, and luxury home sales were up, but most statistics were remarkably similar to last year's. The SF and Oakland-Berkeley markets are currently the strongest in the Bay Area.
Home Sales by Price Range & Bedroom Count
Below is an illustration of sales of houses, condos, co-ops and TICs over the past 12 months, by price segment and by number of bedrooms.
Condos now constitute the biggest share of sales in San Francisco, which mostly explains the high columns for 1- and 2-bedroom sales in the $500,000 to $1.5 million range.
District Sales & Median Home Prices
The next 2 charts break down the last 12 months of sales by Realtor District (delineated on the map above). Some districts were split into 2 for these analyses, but all these areas contain neighborhoods of differing characteristics and home values.
House Sales, Median Prices & Median Sizes
The two biggest districts by volume of house sales - Bayview/ Excelsior/ Crocker Amazon (D10) and Sunset/ Parkside/ GG Heights (D2) - are also 2 of the 3 most affordable districts for purchasing a house in the city. Many of the older districts with bigger, more expensive houses are relatively small markets.
Condo Sales & Median 2-BR/2-BA Condo Prices
Condo sales in SF run across a wide range of eras and styles, from Victorian and Edwardian units in small buildings, through brand new, ultra-luxury high-rise penthouses. The breakout of median sales prices pertain to 2-bedroom, 2 bath condos only.
San Francisco Luxury Homes Markets by District
We typically define the SF luxury house market as houses selling for $3 million+, and the luxury condo, co-op and TIC market as those selling for $2 million+.
SF Luxury House Sales by District
The central Noe, Eureka and Cole Valleys district (D5) dominates the market for houses selling from $3 to $4.99 million. The northern Pacific Heights-Cow Hollow district (D7) dominates the $5 million+ ultra-luxury segment. But high-end home sales are scattered across the city.
Luxury Condo, Co-op & TIC Sales by District
Luxury condo sales are concentrated in 3 districts: District 9, where most of the newer, high-rise, luxury projects are found in the South Beach/Yerba Buena area (which 30 years ago was filled with parking lots and auto-stereo shops), and in the old-prestige, northern neighborhoods of Districts 7 & 8, which include Pacific Heights and Russian Hill. (This is also where the city's high-price co-op units are clustered).
Q1 2019 "Ultra-Luxury" Homes Markets
We start the "ultra-luxury" segments at $5 million for houses, and $3 million for condos and co-ops. There has been a large (and continuing) surge in the construction of very expensive condo projects over the last 15 years, which makes for a greatly increased inventory of high-price condos for sale - and softer market dynamics.
House Size & Era of Construction
Many factors influence home construction size during any particular period: Affluence, economic conditions, household size, buyer age, land costs, population growth, natural disasters, etc. Generally speaking, the median size of houses was larger during the Victorian-Edwardian era, and declined through the 1940's - when enormous swathes of the city were built out in the south and southwest districts. Home sizes then began increasing again, and are now larger than ever - however, few new houses are currently built in the city.
The sizes of houses built in earlier periods have increased over the years due to renovations: Adding that 2nd bathroom, or a 3rd bedroom behind the garage.
Condos have become the major alternative for people purchasing homes of smaller size.
Selected Demographic & Economic Factors
Population Growth
SF has seen a dramatic population increase over the past 10 years, and by percentage growth, SF had the 2nd highest rate in the Bay Area after Alameda County. But new census data indicates the rate of growth is rapidly dropping.
Our latest burst of growth - an increase of about 78,000 or 10% - with all its social and economic effects, looks paltry compared to the 1940's, when the city's population soared by 140,000, a jump of 22% that began with WWII.
Commuting
Venture Capital Investment
In recent years, the Bay Area has been the biggest destination of venture capital investment dollars in the country - and probably the world. These tens of billions of dollars have constituted a massive factor in the local economy, supercharging the creation of new companies, hiring, and, eventually, IPOs. Venture capital is effectively seed money that has exploded into the creation of stupendous amounts of new wealth.
It is impossible to know how median and average value statistics apply to any particular home without a specific comparative market analysis.
These analyses were made in good faith with data from sources deemed reliable, but may contain errors and are subject to revision. It is not our intent to convince you of a particular position, but to attempt to provide straightforward data and analysis, so you can make your own informed decisions. Median and average statistics are enormous generalities: There are hundreds of different markets in San Francisco and the Bay Area, each with its own unique dynamics. Median prices and average dollar per square foot values can be and often are affected by other factors besides changes in fair market value. Longer term trends are much more meaningful than short-term.
Compass is a real estate broker licensed by the State of California, DRE 01527235. Equal Housing Opportunity. This report has been prepared solely for information purposes. The information herein is based on or derived from information generally available to the public and/or from sources believed to be reliable. No representation or warranty can be given with respect to the accuracy or completeness of the information. Compass disclaims any and all liability relating to this report, including without limitation any express or implied representations or warranties for statements contained in, and omissions from, the report. Nothing contained herein is intended to be or should be read as any regulatory, legal, tax, accounting or other advice and Compass does not provide such advice. All opinions are subject to change without notice. Compass makes no representation regarding the accuracy of any statements regarding any references to the laws, statutes or regulations of any state are those of the author(s). Past performance is no guarantee of future results.